

Divorce Rate in Canada: Beyond the 50% Myth (2026)
Fertility Lawyer
This article is general information only. It is not legal advice, and reading it does not create a lawyer-client relationship. Every situation is different, so if you have a legal issue, speak to a lawyer who can give you advice specific to your circumstances.
Do Half of All Marriages End in Divorce?
In my practice, clients frequently arrive assuming that “half of all marriages end in divorce.” That oversimplifies the issue. The often-cited 50% figure comes from a crude projection method that compares divorces in a given year to marriages in that same year. Those are two different populations, and the comparison produces a misleading result.
A better measure looks at what proportion of marriages entered into during a given period will eventually end in divorce. The Department of Justice Canada previously estimated that 40% to 50% of Canadian marriages could end in divorce if trends at the time continued. But more recent data suggests the actual figure is lower. Statistics Canada’s total divorce rate (TDR) — an actuarial measure that estimates lifetime divorce probability based on current age-specific rates — stood at 369.4 per 1,000 marriages in 2019, which translates to roughly 37%. With divorce rates continuing to decline and the married population becoming increasingly self-selected (older, more financially stable, more deliberate), the real number today is likely below 40% and falling.
In 2020, 42,933 divorces were granted across the country (Statistics Canada), or “5.6 per 1,000 married persons” — though the 2020 figure is depressed by pandemic court closures. To understand why that number has been falling for three decades, it helps to look at how the law changed.
How the Divorce Rate Has Changed Over 50 Years
Canada’s divorce rate has changed sharply over time, shaped largely by changes in the law.
Before 1968, getting a divorce in Canada was extraordinarily difficult (see Library of Parliament, Divorce Law in Canada). The grounds were extremely narrow — a husband could divorce for adultery, while a wife generally had to prove adultery combined with cruelty, desertion, or other aggravating conduct — and some provinces had no divorce courts at all, forcing couples to seek a private Act of Parliament (a process that persisted in Quebec and Newfoundland until the 1968 Act). The result was an artificially low divorce rate that did not reflect how many marriages were actually failing.
The 1968 Divorce Act changed everything. For the first time, it introduced “marriage breakdown” as a ground for divorce, allowing couples to divorce after living apart for three years. The divorce rate surged immediately, likely because many couples who had previously lacked a viable legal route now had access to one.
Then came the 1985 reforms to the Divorce Act (which took effect on June 1, 1986), reducing the separation period from three years to one. The divorce rate spiked again, reaching its all-time peak of 97,773 divorces in 1987. Since that peak, the rate has been in steady decline across every province and territory in the country.
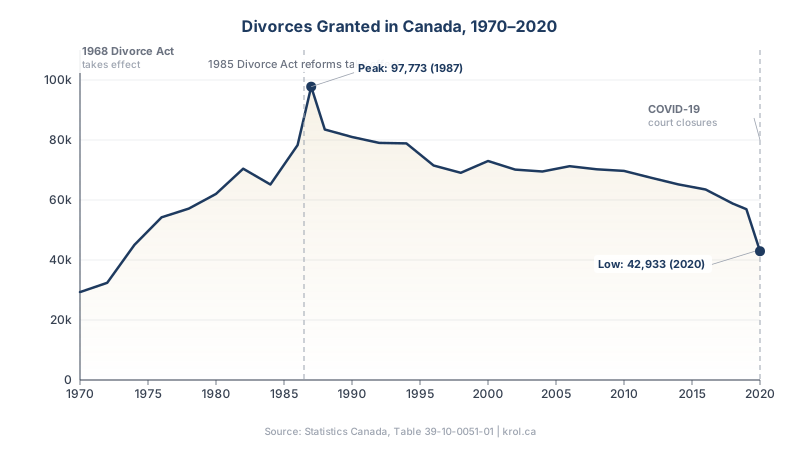
Data: Statistics Canada, Table 39-10-0051-01. You may use or embed this chart with attribution to krol.ca.
Historical Divorce Rates in Canada
| Year | Divorces | Rate per 1,000 | Context |
|---|---|---|---|
| 1970 | 29,301 | — | Post-1968 Act surge |
| 1987 | 97,773 | — | Peak year after 1985 reforms |
| 1991 | 78,954 | 12.7 | Start of long-term decline |
| 2000 | 73,005 | 11.3 | Gradual decline continues |
| 2010 | 69,684 | 10.1 | Continued downward trend |
| 2019 | 56,937 | 7.5 | Pre-pandemic |
| 2020 | 42,933 | 5.6 | 50-year low |
Source: Statistics Canada, "A fifty-year look at divorces in Canada, 1970 to 2020"; Chart A.001; Table 39-10-0051-01.
The sharp drop between 2019 and 2020 is partly explained by the COVID-19 pandemic, which slowed court processing across the country, but the long-term downward trend was already well established before the pandemic began.
Why Is the Divorce Rate Falling?
Several factors explain the decline:
Fewer people are marrying. In 2021, only 44% of Canadians over age 15 were married, down from 54% in 1991 (Vanier Institute of the Family, Families Count 2024). Common-law partnerships accounted for 22.7% of all couples as of the 2021 Census, the highest rate among G7 countries. When those relationships end, the separations do not appear in divorce statistics. The marriage pool has shrunk as a result, which means that the people who do marry tend to be older and more financially established than previous generations were at the time of their weddings.
Canadians are marrying later. The average age at marriage was 34.8 years in 2020, down slightly from 35.3 in 2019 due to pandemic-related changes in who married that year, but the long-term trend is sharply upward (Statistics Canada, “I don’t”: Historic decline in new marriages). In the 1970s, the average was in the mid-twenties. Later marriage is often associated with greater stability, though the reasons are complex and not reducible to a single factor.
The married population is older. Population aging combined with later marriage means that married Canadians are, on average, older than in previous decades, which may reduce the overall divorce rate if younger marriages carry higher risk of dissolution.
This is consistent with what we see in practice: the clients coming through our door are primarily over 30, with a growing proportion falling into the later-in-life category. That group, sometimes called “grey divorce,” is the one segment where divorce rates have not declined as sharply as the overall trend would suggest.
Are Marriages Actually Getting More Stable?
Not necessarily. The divorce rate is falling, but so is the marriage rate — and marriage is falling faster.
In the 1940s through early 1970s, more than 95% of Canadians would have ever married based on the age-specific rates at the time. By 2019, that figure had dropped to 59% (Statistics Canada). The crude marriage rate fell to 3.9 per 1,000 population in 2019, and the total number of marriages dropped from 146,121 in 2019 to 98,355 in 2020, a 33% decline that was the largest since 1921.
Meanwhile, the total divorce rate (TDR) — an actuarial measure from Statistics Canada that estimates the proportion of marriages that would end in divorce if current rates persisted — stood at 369.4 per 1,000 marriages in 2019. That translates to roughly 37% of marriages ending in divorce within 50 years — below the Department of Justice’s earlier 40–50% projection, and still falling.
The implication: the raw number of divorces is falling partly because there are fewer marriages to end. The people who still choose to marry may be a more self-selected group — older, more financially stable, more deliberate — but the data does not show that marriage itself has become dramatically more durable. It shows that fewer people are entering it.
This also reshapes the “grey divorce” trend. When people marry at 32 instead of 22, a 15-year marriage ends at 47 rather than 37. That alone pushes the average age at divorce upward without any change in behaviour. At the same time, couples who would have married young in earlier generations are now staying common law for years — sometimes permanently. When those relationships end in the partners’ 30s or early 40s, they never appear in the divorce statistics. What remains in the married pool skews older, which makes “grey divorce” look like a growing phenomenon when it may partly be a composition effect: the denominator changed, not the behaviour.
Divorce Rates by Province and Territory
The divorce rate varies significantly across the country, reflecting regional differences in demographics, culture, and economic conditions. Here is the most recent available provincial data from Statistics Canada:
Provincial and Territorial Divorce Rates (per 1,000 married persons)
| Province / Territory | 1991–1995 | 2016–2020 | Change |
|---|---|---|---|
| Yukon | 17.7 | 12.8 | -28% |
| Alberta | 14.1 | 9.7 | -31% |
| Quebec | 14.3 | 8.0 | -44% |
| Saskatchewan | 10.6 | 7.7 | -27% |
| British Columbia | 14.2 | 7.5 | -47% |
| Northwest Territories | 11.0 | 7.5 | -32% |
| New Brunswick | 9.4 | 7.4 | -21% |
| Nova Scotia | 11.3 | 7.3 | -35% |
| Ontario | 12.2 | 7.2 | -41% |
| Manitoba | 11.4 | 7.1 | -38% |
| Prince Edward Island | 8.8 | 6.6 | -25% |
| Newfoundland and Labrador | 7.9 | 6.2 | -22% |
| Nunavut | 11.0 | 2.4 | -78% |
| Canada | 12.8 | 7.7 | -40% |
Source: Statistics Canada, Table 39-10-0051-01; provincial data from Table T002a.
Ontario’s rate dropped from 12.2 to 7.2 per 1,000, a 41% decline that closely mirrors the national trend. Between 2019 and 2020 specifically, Ontario saw an approximately 36% decline in divorces granted, the steepest of any province, because Ontario’s courts were among the hardest hit by pandemic-related closures and the resulting backlog in processing applications.
Quebec’s 44% drop is the most dramatic in the table, but it is partly a measurement artifact. Quebec has by far the highest rate of common-law partnerships in the country. In the 2021 Census, 43% of couples in Quebec were living common law, compared to a national average of 23%. Remove Quebec from the national figure and Canada’s common-law rate drops to 17%. Common-law partnership in Quebec functions, in practice, more like a permanent family arrangement than a step toward marriage. Common-law couples in Quebec are actually more likely to have children at home (49%) than married couples (45%). When fewer people marry in the first place, fewer people divorce. Quebec’s lower divorce rate likely reflects, at least in part, lower marriage rates and higher common-law partnership rates rather than unusually stable marriages.
Alberta and the Yukon consistently have the highest divorce rates in the country. No single data source fully explains why, but demographic and economic factors likely play a role. Alberta has the youngest median age of any province at 38.4 years as of the 2021 Census, compared to a national median of 41.6 (Statistics Canada, Census Table 98-10-0022-01). A younger population may mean a higher proportion of people who married relatively young, though provincial age-at-first-marriage data is not readily available to confirm this. Commentators have also attributed Alberta’s elevated rate in part to its large transient workforce, particularly in the oil and gas sector, where boom-and-bust cycles, demanding work schedules, and long periods of separation can put strain on relationships. People who move to a province for work may also leave behind the extended family and community networks that can help stabilize a marriage under pressure.
Newfoundland and Labrador has historically had the lowest divorce rate among the provinces. The reasons are likely a mix of demographic, cultural, and economic factors rather than any single cause. Newfoundland has the oldest median age of any province at 48.4 years as of the 2021 Census, a full ten years older than Alberta’s (Statistics Canada, Census Table 98-10-0022-01). The province also has a higher proportion of its population in smaller communities. Demographic analysis suggests that strong extended family networks and close-knit community ties may contribute to lower divorce rates in such settings, where separation can carry more visible social consequences. None of this means marriages in Newfoundland are necessarily happier, but the practical and cultural barriers to divorce may be higher.
Who Gets Divorced? Age and Duration
The demographics of divorce have shifted considerably. Who divorces, and when, looks very different than it did a generation ago.
Average age at divorce has risen from 36.2 years in 1980 to approximately 46 years in 2020 (Statistics Canada, Table 39-10-0052-01). As of 2017 (the most recent sex-disaggregated data available), women divorced at an average age of 44.5 years while men divorced at 47.0 years (Table 39-10-0052-01).
Average marriage duration before divorce has increased from 12.5 years in 1980 to 15.3 years in 2020 (Statistics Canada, A fifty-year look at divorces in Canada, 1970 to 2020), which reflects the fact that people are marrying later and that divorces after long marriages have become proportionally more common.
These numbers are consistent with what we see in practice. The typical client walking through our door is in their mid-40s and has been married for 12 to 18 years. Often they married in their late 20s or early 30s, had children, and are now separating as those children approach high school or university. The timing is not coincidental — many couples delay divorce until they feel the children are old enough to handle it, or until the financial and logistical demands of raising young children have eased enough to make separation practical.
Which Age Groups Divorce Most?
The pattern has shifted significantly over three decades. In the early 1990s, younger adults had by far the highest divorce rates. That gap has narrowed as younger divorce rates fell sharply while older divorce rates held steady or rose slightly.
Divorce Rates by Age Group (per 1,000 married persons)
| Age Group | 1991 | 2019 | 2020 | Change (1991–2020) |
|---|---|---|---|---|
| 15–34 years | 21.2 | 11.3 | 8.5 | -60% |
| 35–49 years | 15.7 | 11.8 | 8.7 | -45% |
| 50–64 years | 5.8 | 6.9 | 5.2 | -10% |
| 65+ years | 1.5 | 1.6 | 1.2 | -20% |
Source: Statistics Canada, Table 39-10-0053-01; chart data from Chart A.002.
The 15–34 age group saw its divorce rate fall by 60% between 1991 and 2020. The 50–64 group fell by only 10%. Pre-pandemic (2019), the 50–64 rate had actually risen from its 1991 level of 5.8 to 6.9, before falling back to 5.2 in the pandemic-disrupted 2020. This is the data behind the “grey divorce” trend: older adults are divorcing at rates closer to where they were three decades ago, while younger adults are divorcing far less.
The 2020 figures across all age groups are depressed by court closures rather than by fewer marriages failing. The 2019 column is a better indicator of the pre-pandemic baseline.
When Do Marriages End? Divorce by Duration
Not all marriages are equally at risk. Statistics Canada data on divorce by duration of marriage shows a clear pattern: divorce risk peaks in the early years of a marriage, then declines steadily with time.
Divorce Rate by Duration of Marriage (2020, per 1,000 marriages)
| Years Married | Divorce Rate per 1,000 |
|---|---|
| Under 1 year | 0.2 |
| 1 year | 1.9 |
| 2 years | 8.2 |
| 3 years | 13.6 |
| 4 years | 14.5 |
| 5 years | 14.5 |
| 10 years | 12.1 |
| 20 years | 7.1 |
| 30 years | 3.2 |
| 50 years | 0.3 |
Source: Statistics Canada, Table 39-10-0054-01. 2020 figures; 2019/2020 are preliminary.
The peak is at 4–5 years, with a divorce rate of 14.5 per 1,000 marriages. By 10 years, the rate has dropped to 12.1. By 20 years, it is 7.1. Marriages that last 30 years or more end in divorce at very low rates.
These numbers are from 2020 and are therefore pandemic-depressed across the board. The pattern itself — peak in the early years, steady decline after — has been consistent in the data for decades.
How Canada Compares Internationally
The numbers discussed above use a rate per 1,000 married persons, which is the most useful measure for understanding how likely a given marriage is to end. But international comparisons typically rely on a different metric: the crude divorce rate, which measures divorces per 1,000 total population, including everyone who is single, widowed, or in a common-law relationship. This produces a much lower number because the denominator is so much larger.
By that standard measure, Canada’s crude divorce rate is low relative to many peer countries.
International Crude Divorce Rates
| Country | Rate per 1,000 pop. | Year |
|---|---|---|
| Russia | 3.9 | 2020 |
| China | 3.2 | 2018 |
| United States | 2.5 | 2021 |
| Australia | 2.2 | 2021 |
| France | 1.9 | 2016 |
| Germany | 1.7 | 2021 |
| United Kingdom | 1.5 | 2020 |
| Japan | 1.5 | 2022 |
| Italy | 1.4 | 2023 |
| Mexico | 1.3 | 2022 |
| Canada | 1.1 | 2020 |
| India | 0.1 | — |
Sources: OECD Family Database (SF3.1); United Nations Demographic Yearbook; Wikipedia compilation of national statistics. Data years vary by country.
Canada sits at 1.1 per 1,000 population (2020), well below the OECD-29 unweighted average of 1.77 for 2022 or latest year (and 2.01 pre-pandemic in 2019). The United States, at 2.5, has a rate more than double Canada’s. Among the countries listed here, only India reports a lower figure.
Part of the explanation is structural. Canada’s high rate of common-law partnerships (22.7% of couples as of the 2021 Census) means that many relationship breakdowns never show up in divorce statistics at all. Those couples separate, but they were never married, so no divorce is recorded. Countries with lower common-law rates push more of their relationship dissolution through the formal divorce system.
In practice, clients who have lived in both countries often ask me how Canadian divorce law compares. The legal frameworks differ, most notably because Canada has a single federal Divorce Act while American law varies by state. But the practical experience of going through a divorce in Ontario is broadly comparable in complexity and cost.
The COVID Effect and Post-Pandemic Trends
The 2020 divorce number of 42,933 stands out in the data. It represents a 25% drop from the 56,937 divorces recorded in 2019. But the cause was not a sudden improvement in Canadian marriages. Courts closed.
When the pandemic hit in March 2020, family courts across the country shifted to remote hearings, reduced their caseloads, and suspended many in-person proceedings. Ontario experienced the steepest provincial decline at 36%, consistent with the fact that Ontario courts were among the most affected by pandemic restrictions.
The delays were measurable. The median time from filing to disposition was 4.8 months in the 2018-2019 period before the pandemic. That figure peaked at 5.8 months in 2020 as cases stalled in the system (Statistics Canada). Court backlogs persisted well after restrictions lifted. In general civil (non-family) cases, ongoing matters made up 55% of the active caseload in 2021/2022, declining only gradually to 51% by 2023/2024, and median case processing time peaked at 148 days in 2022/2023 before returning to 134 days in 2023/2024 (Statistics Canada, Canadian general civil caseloads from 2019/2020 to 2023/2024). Family court delays followed a similar pattern.
An important caveat on data currency: Statistics Canada has not yet released official divorce counts for 2021 through 2025. The most recent year in Table 39-10-0051-01 is 2020, and Statistics Canada notes that the 2019 and 2020 figures are preliminary and may be underestimated. The Vital Statistics Divorce Database, which is the source for Canada’s official divorce counts, is listed as “Active” but updates on an “Occasional” basis. No other government source publishes divorce counts for Canada. That means the official divorce rate of 5.6 per 1,000 married persons reflects a pandemic-disrupted year, and we do not yet know what happened after 2020.
From a practical standpoint, the court delays caused by the pandemic were very real. Cases that would have resolved in months stretched into a year or more. The backlogs have largely cleared, but the experience highlighted how dependent the divorce process is on court capacity.
Economic Pressures and the “Can’t Afford to Divorce” Effect
Divorce rates do not just respond to legal changes and demographic shifts. They respond to money.
Economic downturns have historically suppressed divorce rates. During the Great Depression, the US divorce rate dropped approximately 25% between 1929 and 1933. Couples who wanted to separate could not afford to. Maintaining two households on reduced income was simply not feasible for many families, so they stayed together out of financial necessity rather than choice.
The same pattern shows up during periods of high inflation and rising housing costs. When interest rates climbed in 2022 through 2024, the cost of maintaining separate homes rose sharply. Legal fees, moving costs, and the loss of economies of scale that come with a shared household all create a financial barrier. Some researchers have described this as “economic entrapment,” where couples who want to divorce cannot afford to follow through.
There is a counterpoint worth acknowledging. Financial stress is also one of the most commonly cited triggers for marital conflict. Money problems strain relationships. So economic hardship pushes in both directions at once: it creates more reasons to separate while making separation harder to afford.
Historically, the net effect is that economic hardship tends to delay divorces rather than prevent them. The underlying relationship breakdown does not resolve itself because housing is expensive. When conditions improve, the pent-up demand surfaces. Couples who were waiting for a better financial moment to separate go ahead and file.
I see both sides of this in practice. Some clients come in saying they have been waiting years to file because they could not afford to maintain two households on their current income. Others come in precisely because financial stress has made the relationship untenable. The practical question in many of these cases is not whether to separate but how to structure the financial arrangements so both parties can afford to live independently.
If you are considering divorce in Ontario, the statistics matter less than the specifics of your situation. Every marriage is different, and the right approach depends on the issues involved — children, property, support — and how willing both sides are to resolve them. Getting proper legal advice early makes the biggest practical difference. For a practical overview, see our guides on how long divorce takes in Ontario and the cost of divorce in Ontario.
Frequently Asked Questions
What is the divorce rate in Canada?
The most recent official data from Statistics Canada is from 2020, when Canada’s divorce rate stood at 5.6 per 1,000 married persons, a 50-year low. No official figures have been published for 2021 through 2025.
What percentage of marriages end in divorce in Canada?
The Department of Justice Canada previously estimated that 40% to 50% of Canadian marriages could end in divorce. However, the most recent actuarial data from Statistics Canada (the total divorce rate for 2019) puts the figure closer to 37%, and the trend is still declining. The commonly cited “50%” figure comes from a less accurate method that compares annual divorces to annual marriages — two different populations.
Is Canada's divorce rate going up or down?
On the official data available through 2020, the long-term trend is clearly downward. The divorce rate fell from 12.7 per 1,000 married persons in 1991 to 5.6 per 1,000 in 2020, a decline of more than 55% and the lowest rate since 1973. The decline is driven by fewer marriages overall, later age at marriage, and an increase in common-law partnerships that fall outside divorce statistics.
How does Ontario's divorce rate compare to other provinces?
Ontario’s 2016-2020 average rate was 7.2 per 1,000 married persons, slightly below the national average of 7.7. Alberta (9.7) and the Yukon (12.8) have the highest rates, while Newfoundland and Labrador (6.2) has the lowest among the provinces.
How long does the average marriage last before divorce?
The average duration of a marriage ending in divorce in Canada is 15.3 years as of 2020, up from 12.5 years in 1980. This increase reflects both later marriages and a growing proportion of “grey divorces” among older couples.
What are the legal grounds for divorce in Canada?
The Divorce Act recognizes one ground: breakdown of the marriage. This can be proven by (1) living separate and apart for at least one year, (2) adultery, or (3) physical or mental cruelty.
Do I need to prove fault to get a divorce in Canada?
No. Canada introduced no-fault divorce with the 1968 Divorce Act, which allowed divorce after three years of separation. The 1985 amendments shortened that to one year. You can obtain a divorce simply by demonstrating one year of separation without needing to prove your spouse did anything wrong. Adultery and cruelty remain as alternative grounds, but they are rarely used because the one-year separation route achieves the same outcome with less conflict.
What is no-fault divorce?
No-fault divorce means you can end your marriage without proving that your spouse did something wrong — such as adultery or cruelty. In Canada, no-fault divorce on the basis of a one-year separation has been available since the 1985 amendments to the Divorce Act. Most Canadian divorces use this ground because it avoids the cost and conflict of proving fault.
What is "grey divorce" and is it increasing?
Grey divorce refers to divorce among couples aged 50 and older. While overall divorce rates have been declining, grey divorce rates have not fallen as quickly, making this group a larger share of all divorces. But part of the trend is a composition effect: Canadians are marrying later, so a marriage that ends after 15 years now produces a divorce at 47 rather than 37. At the same time, many younger couples are staying common law rather than marrying, and when those relationships end they never appear in divorce statistics. The married pool skews older as a result, which inflates the grey divorce share even if older couples are not actually divorcing more than before. Longer life expectancy and greater financial independence among older adults are also contributing factors.
How long does a divorce take in Ontario?
An uncontested divorce in Ontario typically takes four to six months from filing to the granting of the divorce order, while contested divorces can take a year or longer depending on the issues involved. For a detailed breakdown, see our guide on how long divorce takes in Ontario.
If you have questions about divorce in Ontario, contact Krol & Krol for a consultation.
Have Questions About Your Situation?
Every family law matter is different. Contact us for guidance specific to your circumstances.
Book a Consultation